Friday, May 29, 2015

Is Brand a Google Ranking Factor? - Whiteboard Friday

Posted by randfish

A frequently asked question in the SEO world is whether or not branding plays a part in Google's ranking algorithm. There's a short answer with a big asterisk, and in today's Whiteboard Friday, Rand explains what you need to know.

Is Brand a Google Ranking Factor Whiteboard

For reference, here's a still of this week's whiteboard. Click on it to open a high resolution image in a new tab!

Video Transcription

Howdy, Moz fans, and welcome to another edition of Whiteboard Friday. This week I'm going to try and answer a question that plagues a lot of marketers, a lot of SEOs and that we ask very frequently. That is: Is brand or branding a ranking factor in Google search engine?

Look, I think, to be fair, to be honest, that the technical answer to this question is no. However, I think when people say brand is powerful for SEO, that is a true statement. We're going to try and reconcile these two things. How can brand not be a ranking factor and yet be a powerful influencer of higher rankings in SEO? What's going to go on there?

What is a ranking factor, anyway?

Well, I'll tell you. So when folks say ranking factor, they're referring to something very technical, very specific, and that is an algorithmic input that Google measures directly and uses to determine rank position in their algorithm.

Okay, guess what? Brand almost certainly is not this.

Google doesn't try and go out and say, "How well known is Coca-Cola versus Pepsi versus 7 Up versus Sprite versus Jones Cola? Hey, let's rank Coca-Cola a little higher because they seem to have greater brand awareness, brand affinity than Pepsi." That is not something that Google will try and do. That's not something that's in their algorithm.

However, a big however, many things that are in Google's ranking algorithm correlate very well with brands.

Those things are probably used by Google in both direct and indirect ways.

So when you see sites that have done a great job of branding and also have good SEO best practices on them, you'll notice kind of a correlation, like boy, it sure does seem like the brands have been performing better and better in Google's rankings over the last four, five, or six years. I think this is due to two trends. One of those trends is that Google's algorithmic inputs have started favoring things that brands are better at and that what I'd call generic sites or non-branded sites, or businesses that have not invested in brand affinity have not done well.

Those things are things like links, where Google is rewarding better links rather than just more links. They're things around user and usage data, which Google previously didn't use a whole lot of signals around that. Same story with user experience. Same story with things like pogo sticking, which is probably one of the ways that they're measuring some of that stuff.

If we were to scatter plot it, we'd probably see something like this, where the better your brand performs as a brand, the higher and better it tends to perform in the rankings of Google search engine.

How does brand correlate to ranking signals?

Now, how is it that these brand signals that I'm talking about correlate more directly to ranking signals? Like why does this impact and influence? I think if we understand that, we can understand why we need to invest in brand and branding and where to invest in it as it relates to the web marketing kinds of things that we do for SEO.

One very clearly and very frankly is links. So when we talk about the links that Google wants to measure, wants to count today, those are organic, editorially earned links. They're not manipulative. They weren't bought. They tend not to be cajoled, they're earned.

Because of that, one of the best ways that folks have been earning links is to get people to come to their website and then have some fraction, some percentage of those folks naturally link to them without having to do any extra effort. It's basically like, “Hey, you made this great piece of content or this great product or great service or great data. Therefore, I'm going to reference it." Granted, that's a small percentage of people. There's still only maybe two or three out of a hundred folks who might visit your website on the Internet who actually have the power or ability to link to you because they control content on the web as opposed to just social sharing.

But when that happens, in a lot of cases folks go and they say, "Hmm, yeah, this content's good, but I've never heard of this brand before. I'm not sure if I should recommend it. It looks good, but I don't know them." Versus, "Oh, I love these folks. This is like one of my favorite companies or brands or products or experiences, and this content is great. I am totally going to link to it." Because that happens, even if that difference is small, even if the percent goes from 1% to 2%, well now, guess what? For every hundred visits, you're earning twice the links of your non-branded competitor.

Social signals

These are pretty much exactly the same thing. Folks who visit content, who have experiences with a company, with a product, or with a service, if they're familiar and comfortable with the brand, if they want to evangelize that brand, then guess what? You're going to get more social sharing per visit, per exposure than you would ordinarily, and that's going to lead to a cycle of more social sharing which leads to visits which probably leads to links.

User and usage data

It's also true that brand is going to impact user and usage data. So one of the most interesting patents, which we'll probably be talking about in a future Whiteboard Friday, was brought up recently by Bill Slowsky and looked at user and usage data. It was just granted to Google in the last month. It talked about how Google would look at the patterns of where web visitors would go and what their search experiences would be like. It would potentially say, "Hey, Google would like to reward sites that are getting organic traffic, not just from search, but traffic of all kinds on a particular topic."

So if it turns out that lots of people who are researching a vacation to Costa Rica end up going to Oyster.com, well, Google might say, "Hey, you know what? We've seen this pattern over and over again. Let's boost Oyster.com's rankings because it seems like people who look for this kind of content end up on this site. Not necessarily directly through us, through Google. They might end up on it through social media, through organic web links, through direct visits, through e-mail marketing, whatever it is."

When you're unbranded, one of the few ways that you can get traffic is through unbranded search. Search is one of those few channels that does drive traffic, or historically anyway did drive traffic to a lot of non-branded, less branded sites. Brands tend to earn traffic from a wide variety of sources. If you can start earning traffic from lots of sources and have the retention and the experience to drive people back again and again, well, probably you're going to benefit from some of these potential algorithmic shifts and future looking directions that Google's got.

Click-through rates

Same story a little bit when it comes to click-through rate. Now, we know from experience and testing that click-through rate is or appears to have a very direct impact on rankings. If lots of people are performing a search and they click on your website in position number four or five, and they're not clicking on position one, two, or three, you can bet that you're going to be moving up those rankings very, very quickly.

Granted there is some manipulative services out there that try and automate this. Some of them work for a little while. Most of them get shut down pretty quick. I wouldn't recommend investing in those. But I do recommend investing in brand, because when you have a recognizable brand, searchers are going to come here and they're going to go, "Oh, that one, maybe I haven't heard of it. That one, I've heard of it. That one, I haven't heard of it."

Guess what they're clicking on? The one they're already familiar with. The one they have a positive association with already. This is the power of brand advertising, and I think it's one of the big reasons why you've seen case studies from folks like Seer Interactive, talking about how a radio ad campaign or a billboard ad campaign seemed to have a positive lift in their SEO work as well. This phenomenon is going to mean that you're benefiting from every searcher who looks for something, even if you rank further down, if you're the better known brand.

So is brand a ranking factor? No, it's not. Is brand something that positively impacts SEO? Almost certainly in every niche, yes, it is.

All right. Looking forward to some great comments. I'll try and jump in there and answer any questions that I can. If you have experiences you want to share, we'd love to hear from you. Hopefully, we'll see you again next week for another edition of Whiteboard Friday. Take care.

Video transcription by Speechpad.com


Sign up for The Moz Top 10, a semimonthly mailer updating you on the top ten hottest pieces of SEO news, tips, and rad links uncovered by the Moz team. Think of it as your exclusive digest of stuff you don't have time to hunt down but want to read!


from Moz Blog http://ift.tt/1LNbQnF
via IFTTT

Thursday, May 28, 2015

Your Daily SEO Fix: Week 2

Posted by Trevor-Klein

Last week, we began posting short (< 2-minute) video tutorials that help you all get the most out of Moz's tools. Each tutorial is designed to solve a use case that we regularly hear about from Moz community members—a need or problem for which you all could use a solution.

Today, we've got a brand-new roundup of the most recent videos:

  • How to Examine and Analyze SERPs Using New MozBar Features
  • How to Boost Your Rankings through On-Page Optimization
  • How to Check Your Anchor Text Using Open Site Explorer
  • How to Do Keyword Research with OSE and the Keyword Difficulty Tool
  • How to Discover Keyword Opportunities in Moz Analytics

Let's get right down to business!

Fix 1: How to Examine and Analyze SERPs Using New MozBar Features

The MozBar is a handy tool that helps you access important SEO metrics while you surf the web. In this Daily SEO Fix, Abe shows you how to use this toolbar to examine and analyze SERPs and access keyword difficulty scores for a given page—in a single click.


Fix 2: How to Boost Your Rankings through On-Page Optimization

There are several on-page factors that influence your search engine rankings. In this Daily SEO Fix, Holly shows you how to use Moz's On-Page Optimization tool to identify pages on your website that could use some love and what you can do to improve them.


Fix 3: How to Check Your Anchor Text Using Open Site Explorer

Dive into OSE with Tori in this Daily SEO Fix to check out the anchor text opportunities for Moz.com. By highlighting all your anchor text you can discover other potential keyword ranking opportunities you might not have thought of before.


Fix 4: How to Do Keyword Research with OSE and the Keyword Difficulty Tool

Studying your competitors can help identify keyword opportunities for your own site. In this Daily SEO Fix, Jacki walks through how to use OSE to research the anchor text for competitors websites and how to use the Keyword Difficulty Tool to identify potential expansion opportunities for your site.


Fix 5: How to Discover Keyword Opportunities in Moz Analytics

Digesting organic traffic that is coming to your site is an easy way to surface potential keyword opportunities. In this Daily SEO Fix, Chiaryn walks through the keyword opportunity tab in Moz Analytics and highlights a quick tip for leveraging that tool.


Looking for more?

We've got more videos in last week's round-up! Check it out here.


Don't have a Pro subscription? No problem. Everything we cover in these Daily SEO Fix videos is available with a free 30-day trial.

Sounds good. Sign me up!


Sign up for The Moz Top 10, a semimonthly mailer updating you on the top ten hottest pieces of SEO news, tips, and rad links uncovered by the Moz team. Think of it as your exclusive digest of stuff you don't have time to hunt down but want to read!


from Moz Blog http://ift.tt/1LM38pU
via IFTTT

Enlaces profundos de aplicaciones con goo.gl


A partir de ahora, los enlaces cortos goo.gl funcionarán como enlaces únicos que podrás utilizar para todo tu contenido, independientemente de si está en tu aplicación de Android, iOS o en tu sitio web. Cuando hayas seguido los pasos necesarios para configurar la indexación de aplicaciones para Android y iOS, las URL de goo.gl enviarán a los usuarios directamente a la página correcta de tu aplicación si la tienen instalada y, si no es así, a tu sitio web. Esto ofrece muchas más oportunidades a los usuarios de interactuar de nuevo con tu aplicación.

Esta característica funciona con las nuevas URL cortas y con las anteriores de forma retroactiva, de modo que todos los enlaces cortos goo.gl que ya existían para tu contenido también enviarán ahora a los usuarios a tu aplicación.


Compartir enlaces que "hacen lo correcto"

Saca el máximo partido a esta función mediante la integración de la API de acortamiento de URL en el flujo de contenido compartido de tu aplicación. De esta manera, los usuarios podrán compartir enlaces que redireccionen automáticamente a tu aplicación nativa en todas las plataformas. Además, otros usuarios podrán insertar enlaces en sus sitios web y aplicaciones que lleven directamente a tu aplicación.

Veamos el ejemplo de Google Maps. Gracias a los nuevos enlaces goo.gl para todas las plataformas, el botón de compartir de Maps genera un enlace óptimo para todos. Cuando se abre, el enlace detecta de forma automática la plataforma del usuario y si este tiene Maps instalado. Si tiene la aplicación instalada, el enlace corto abre el contenido directamente en la aplicación Maps en Android o en iOS. En caso contrario o si el usuario utiliza un ordenador, el enlace corto abre la página en el sitio web de Maps.

Pruébalo tú mismo. No te olvides de usar un teléfono con la aplicación Google Maps instalada: http://goo.gl/maps/xlWFj.

Configuración

Para configurar enlaces profundos de aplicaciones en goo.gl:

  1. Sigue los pasos necesarios para participar en la indexación de aplicaciones para Android y iOS descritos en g.co/AppIndexing. Ten en cuenta que los enlaces profundos goo.gl están abiertos a todos los desarrolladores de iOS a diferencia de los enlaces profundos de Búsqueda actuales. Después de este paso, los enlaces cortos goo.gl comenzarán a actuar de enlaces profundos y enviarán a los usuarios a tu aplicación. 
  2. (Opcional) Integra la API de acortamiento de URL en el flujo de contenido compartido de tu aplicación, tus campañas de correo electrónico, etc. para generar automáticamente enlaces profundos que envíen a los usuarios a tu aplicación. 

Esperamos que disfrutes de esta nueva funcionalidad y que se compartan muchos contenidos tuyos en todas las plataformas.


Escrito por Fabian Schlup, Software Engineer. Publicado por Javier Pérez equipo de calidad de búsqueda.

from El Blog para Webmasters http://ift.tt/1ckKpVu
via IFTTT

Wednesday, May 27, 2015

Deconstructing the App Store Rankings Formula with a Little Mad Science

Posted by AlexApptentive

After seeing Rand's "Mad Science Experiments in SEO" presented at last year's MozCon, I was inspired to put on the lab coat and goggles and do a few experiments of my own—not in SEO, but in SEO's up-and-coming younger sister, ASO (app store optimization).

Working with Apptentive to guide enterprise apps and small startup apps alike to increase their discoverability in the app stores, I've learned a thing or two about app store optimization and what goes into an app's ranking. It's been my personal goal for some time now to pull back the curtains on Google and Apple. Yet, the deeper into the rabbit hole I go, the more untested assumptions I leave in my way.

Hence, I thought it was due time to put some longstanding hypotheses through the gauntlet.

As SEOs, we know how much of an impact a single ranking can mean on a SERP. One tiny rank up or down can make all the difference when it comes to your website's traffic—and revenue.

In the world of apps, ranking is just as important when it comes to standing out in a sea of more than 1.3 million apps. Apptentive's recent mobile consumer survey shed a little more light this claim, revealing that nearly half of all mobile app users identified browsing the app store charts and search results (the placement on either of which depends on rankings) as a preferred method for finding new apps in the app stores. Simply put, better rankings mean more downloads and easier discovery.

Like Google and Bing, the two leading app stores (the Apple App Store and Google Play) have a complex and highly guarded algorithms for determining rankings for both keyword-based app store searches and composite top charts.

Unlike SEO, however, very little research and theory has been conducted around what goes into these rankings.

Until now, that is.

Over the course of five studies analyzing various publicly available data points for a cross-section of the top 500 iOS (U.S. Apple App Store) and the top 500 Android (U.S. Google Play) apps, I'll attempt to set the record straight with a little myth-busting around ASO. In the process, I hope to assess and quantify any perceived correlations between app store ranks, ranking volatility, and a few of the factors commonly thought of as influential to an app's ranking.

But first, a little context

Apple App Store vs. Google Play

Image credit: Josh Tuininga, Apptentive

Both the Apple App Store and Google Play have roughly 1.3 million apps each, and both stores feature a similar breakdown by app category. Apps ranking in the two stores should, theoretically, be on a fairly level playing field in terms of search volume and competition.

Of these apps, nearly two-thirds have not received a single rating and 99% are considered unprofitable. These studies, therefore, single out the rare exceptions to the rule—the top 500 ranked apps in each store.

While neither Apple nor Google have revealed specifics about how they calculate search rankings, it is generally accepted that both app store algorithms factor in:

  • Average app store rating
  • Rating/review volume
  • Download and install counts
  • Uninstalls (what retention and churn look like for the app)
  • App usage statistics (how engaged an app's users are and how frequently they launch the app)
  • Growth trends weighted toward recency (how daily download counts changed over time and how today's ratings compare to last week's)
  • Keyword density of the app's landing page (Ian did a great job covering this factor in a previous Moz post)

I've simplified this formula to a function highlighting the four elements with sufficient data (or at least proxy data) for our analysis:

Ranking = fn(Rating, Rating Count, Installs, Trends)

Of course, right now, this generalized function doesn't say much. Over the next five studies, however, we'll revisit this function before ultimately attempting to compare the weights of each of these four variables on app store rankings.

(For the purpose of brevity, I'll stop here with the assumptions, but I've gone into far greater depth into how I've reached these conclusions in a 55-page report on app store rankings.)

Now, for the Mad Science.

Study #1: App-les to app-les app store ranking volatility

The first, and most straight forward of the five studies involves tracking daily movement in app store rankings across iOS and Android versions of the same apps to determine any trends of differences between ranking volatility in the two stores.

I went with a small sample of five apps for this study, the only criteria for which were that:

  • They were all apps I actively use (a criterion for coming up with the five apps but not one that influences rank in the U.S. app stores)
  • They were ranked in the top 500 (but not the top 25, as I assumed app store rankings would be stickier at the top—an assumption I'll test in study #2)
  • They had an almost identical version of the app in both Google Play and the App Store, meaning they should (theoretically) rank similarly
  • They covered a spectrum of app categories

The apps I ultimately chose were Lyft, Venmo, Duolingo, Chase Mobile, and LinkedIn. These five apps represent the travel, finance, education banking, and social networking categories.

Hypothesis

Going into this analysis, I predicted slightly more volatility in Apple App Store rankings, based on two statistics:

Both of these assumptions will be tested in later analysis.

Results

7-Day App Store Ranking Volatility in the App Store and Google Play

Among these five apps, Google Play rankings were, indeed, significantly less volatile than App Store rankings. Among the 35 data points recorded, rankings within Google Play moved by as much as 23 positions/ranks per day while App Store rankings moved up to 89 positions/ranks. The standard deviation of ranking volatility in the App Store was, furthermore, 4.45 times greater than that of Google Play.

Of course, the same apps varied fairly dramatically in their rankings in the two app stores, so I then standardized the ranking volatility in terms of percent change to control for the effect of numeric rank on volatility. When cast in this light, App Store rankings changed by as much as 72% within a 24-hour period while Google Play rankings changed by no more than 9%.

Also of note, daily rankings tended to move in the same direction across the two app stores approximately two-thirds of the time, suggesting that the two stores, and their customers, may have more in common than we think.

Study #2: App store ranking volatility across the top charts

Testing the assumption implicit in standardizing the data in study No. 1, this one was designed to see if app store ranking volatility is correlated with an app's current rank. The sample for this study consisted of the top 500 ranked apps in both Google Play and the App Store, with special attention given to those on both ends of the spectrum (ranks 1–100 and 401–500).

Hypothesis

I anticipated rankings to be more volatile the higher an app is ranked—meaning an app ranked No. 450 should be able to move more ranks in any given day than an app ranked No. 50. This hypothesis is based on the assumption that higher ranked apps have more installs, active users, and ratings, and that it would take a large margin to produce a noticeable shift in any of these factors.

Results

App Store Ranking Volatility of Top 500 Apps

One look at the chart above shows that apps in both stores have increasingly more volatile rankings (based on how many ranks they moved in the last 24 hours) the lower on the list they're ranked.

This is particularly true when comparing either end of the spectrum—with a seemingly straight volatility line among Google Play's Top 100 apps and very few blips within the App Store's Top 100. Compare this section to the lower end, ranks 401–)500, where both stores experience much more turbulence in their rankings. Across the gamut, I found a 24% correlation between rank and ranking volatility in the Play Store and 28% correlation in the App Store.

To put this into perspective, the average app in Google Play's 401–)500 ranks moved 12.1 ranks in the last 24 hours while the average app in the Top 100 moved a mere 1.4 ranks. For the App Store, these numbers were 64.28 and 11.26, making slightly lower-ranked apps more than five times as volatile as the highest ranked apps. (I say slightly as these "lower-ranked" apps are still ranked higher than 99.96% of all apps.)

The relationship between rank and volatility is pretty consistent across the App Store charts, while rank has a much greater impact on volatility at the lower end of Google Play charts (ranks 1-100 have a 35% correlation) than it does at the upper end (ranks 401-500 have a 1% correlation).

Study #3: App store rankings across the stars

The next study looks at the relationship between rank and star ratings to determine any trends that set the top chart apps apart from the rest and explore any ties to app store ranking volatility.

Hypothesis

Ranking = fn(Rating, Rating Count, Installs, Trends)

As discussed in the introduction, this study relates directly to one of the factors commonly accepted as influential to app store rankings: average rating.

Getting started, I hypothesized that higher ranks generally correspond to higher ratings, cementing the role of star ratings in the ranking algorithm.

As far as volatility goes, I did not anticipate average rating to play a role in app store ranking volatility, as I saw no reason for higher rated apps to be less volatile than lower rated apps, or vice versa. Instead, I believed volatility to be tied to rating volume (as we'll explore in our last study).

Results

Average App Store Ratings of Top Apps

The chart above plots the top 100 ranked apps in either store with their average rating (both historic and current, for App Store apps). If it looks a little chaotic, it's just one indicator of the complexity of ranking algorithm in Google Play and the App Store.

If our hypothesis was correct, we'd see a downward trend in ratings. We'd expect to see the No. 1 ranked app with a significantly higher rating than the No. 100 ranked app. Yet, in neither store is this the case. Instead, we get a seemingly random plot with no obvious trends that jump off the chart.

A closer examination, in tandem with what we already know about the app stores, reveals two other interesting points:

  1. The average star rating of the top 100 apps is significantly higher than that of the average app. Across the top charts, the average rating of a top 100 Android app was 4.319 and the average top iOS app was 3.935. These ratings are 0.32 and 0.27 points, respectively, above the average rating of all rated apps in either store. The averages across apps in the 401–)500 ranks approximately split the difference between the ratings of the top ranked apps and the ratings of the average app.
  2. The rating distribution of top apps in Google Play was considerably more compact than the distribution of top iOS apps. The standard deviation of ratings in the Apple App Store top chart was over 2.5 times greater than that of the Google Play top chart, likely meaning that ratings are more heavily weighted in Google Play's algorithm.

App Store Ranking Volatility and Average Rating

Looking next at the relationship between ratings and app store ranking volatility reveals a -15% correlation that is consistent across both app stores; meaning the higher an app is rated, the less its rank it likely to move in a 24-hour period. The exception to this rule is the Apple App Store's calculation of an app's current rating, for which I did not find a statistically significant correlation.

Study #4: App store rankings across versions

This next study looks at the relationship between the age of an app's current version, its rank and its ranking volatility.

Hypothesis

Ranking = fn(Rating, Rating Count, Installs, Trends)

In alteration of the above function, I'm using the age of a current app's version as a proxy (albeit not a very good one) for trends in app store ratings and app quality over time.

Making the assumptions that (a) apps that are updated more frequently are of higher quality and (b) each new update inspires a new wave of installs and ratings, I'm hypothesizing that the older the age of an app's current version, the lower it will be ranked and the less volatile its rank will be.

Results

How update frequency correlates with app store rank

The first and possibly most important finding is that apps across the top charts in both Google Play and the App Store are updated remarkably often as compared to the average app.

At the time of conducting the study, the current version of the average iOS app on the top chart was only 28 days old; the current version of the average Android app was 38 days old.

As hypothesized, the age of the current version is negatively correlated with the app's rank, with a 13% correlation in Google Play and a 10% correlation in the App Store.

How update frequency correlates with app store ranking volatility

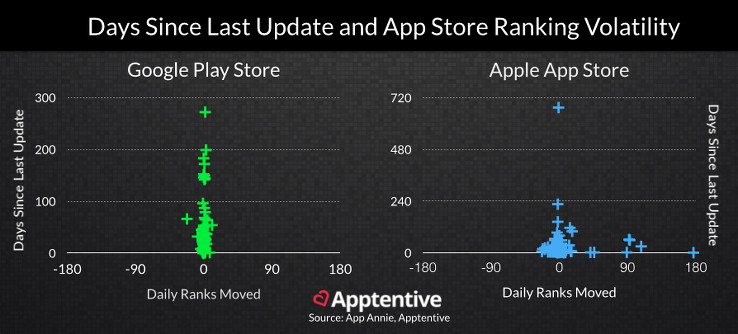
The next part of the study maps the age of the current app version to its app store ranking volatility, finding that recently updated Android apps have less volatile rankings (correlation: 8.7%) while recently updated iOS apps have more volatile rankings (correlation: -3%).

Study #5: App store rankings across monthly active users

In the final study, I wanted to examine the role of an app's popularity on its ranking. In an ideal world, popularity would be measured by an app's monthly active users (MAUs), but since few mobile app developers have released this information, I've settled for two publicly available proxies: Rating Count and Installs.

Hypothesis

Ranking = fn(Rating, Rating Count, Installs, Trends)

For the same reasons indicated in the second study, I anticipated that more popular apps (e.g., apps with more ratings and more installs) would be higher ranked and less volatile in rank. This, again, takes into consideration that it takes more of a shift to produce a noticeable impact in average rating or any of the other commonly accepted influencers of an app's ranking.

Results

Apps with more ratings and reviews typically rank higher

The first finding leaps straight off of the chart above: Android apps have been rated more times than iOS apps, 15.8x more, in fact.

The average app in Google Play's Top 100 had a whopping 3.1 million ratings while the average app in the Apple App Store's Top 100 had 196,000 ratings. In contrast, apps in the 401–)500 ranks (still tremendously successful apps in the 99.96 percentile of all apps) tended to have between one-tenth (Android) and one-fifth (iOS) of the ratings count as that of those apps in the top 100 ranks.

Considering that almost two-thirds of apps don't have a single rating, reaching rating counts this high is a huge feat, and a very strong indicator of the influence of rating count in the app store ranking algorithms.

To even out the playing field a bit and help us visualize any correlation between ratings and rankings (and to give more credit to the still-staggering 196k ratings for the average top ranked iOS app), I've applied a logarithmic scale to the chart above:

The relationship between app store ratings and rankings in the top 100 apps

From this chart, we can see a correlation between ratings and rankings, such that apps with more ratings tend to rank higher. This equates to a 29% correlation in the App Store and a 40% correlation in Google Play.

Apps with more ratings typically experience less app store ranking volatility

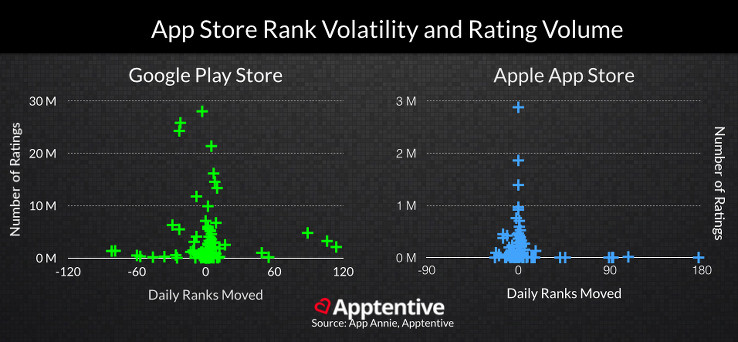
Next up, I looked at how ratings count influenced app store ranking volatility, finding that apps with more ratings had less volatile rankings in the Apple App Store (correlation: 17%). No conclusive evidence was found within the Top 100 Google Play apps.

Apps with more installs and active users tend to rank higher in the app stores

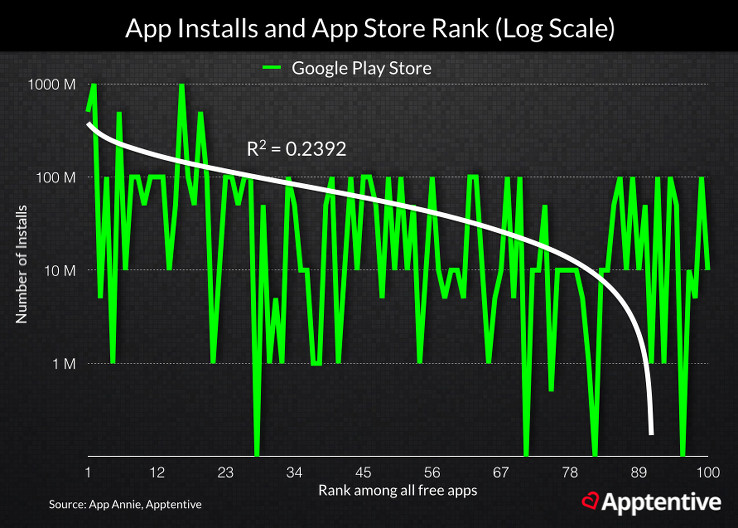
And last but not least, I looked at install counts as an additional proxy for MAUs. (Sadly, this is a statistic only listed in Google Play. so any resulting conclusions are applicable only to Android apps.)

Among the top 100 Android apps, this last study found that installs were heavily correlated with ranks (correlation: -35.5%), meaning that apps with more installs are likely to rank higher in Google Play. Android apps with more installs also tended to have less volatile app store rankings, with a correlation of -16.5%.

Unfortunately, these numbers are slightly skewed as Google Play only provides install counts in broad ranges (e.g., 500k–)1M). For each app, I took the low end of the range, meaning we can likely expect the correlation to be a little stronger since the low end was further away from the midpoint for apps with more installs.

Summary

To make a long post ever so slightly shorter, here are the nuts and bolts unearthed in these five mad science studies in app store optimization:

  1. Across the top charts, Apple App Store rankings are 4.45x more volatile than those of Google Play
  2. Rankings become increasingly volatile the lower an app is ranked. This is particularly true across the Apple App Store's top charts.
  3. In both stores, higher ranked apps tend to have an app store ratings count that far exceeds that of the average app.
  4. Ratings appear to matter more to the Google Play algorithm, especially as the Apple App Store top charts experience a much wider ratings distribution than that of Google Play's top charts.
  5. The higher an app is rated, the less volatile its rankings are.
  6. The 100 highest ranked apps in either store are updated much more frequently than the average app, and apps with older current versions are correlated with lower ratings.
  7. An app's update frequency is negatively correlated with Google Play's ranking volatility but positively correlated with ranking volatility in the App Store. This likely due to how Apple weighs an app's most recent ratings and reviews.
  8. The highest ranked Google Play apps receive, on average, 15.8x more ratings than the highest ranked App Store apps.
  9. In both stores, apps that fall under the 401–500 ranks receive, on average, 10–20% of the rating volume seen by apps in the top 100.
  10. Rating volume and, by extension, installs or MAUs, is perhaps the best indicator of ranks, with a 29–40% correlation between the two.

Revisiting our first (albeit oversimplified) guess at the app stores' ranking algorithm gives us this loosely defined function:

Ranking = fn(Rating, Rating Count, Installs, Trends)

I'd now re-write the function into a formula by weighing each of these four factors, where a, b, c, & d are unknown multipliers, or weights:

Ranking = (Rating * a) + (Rating Count * b) + (Installs * c) + (Trends * d)

These five studies on ASO shed a little more light on these multipliers, showing Rating Count to have the strongest correlation with rank, followed closely by Installs, in either app store.

It's with the other two factors—rating and trends—that the two stores show the greatest discrepancy. I'd hazard a guess to say that the App Store prioritizes growth trends over ratings, given the importance it places on an app's current version and the wide distribution of ratings across the top charts. Google Play, on the other hand, seems to favor ratings, with an unwritten rule that apps just about have to have at least four stars to make the top 100 ranks.

Thus, we conclude our mad science with this final glimpse into what it takes to make the top charts in either store:

Weight of factors in the Apple App Store ranking algorithm

Rating Count > Installs > Trends > Rating

Weight of factors in the Google Play ranking algorithm

Rating Count > Installs > Rating > Trends


Again, we're oversimplifying for the sake of keeping this post to a mere 3,000 words, but additional factors including keyword density and in-app engagement statistics continue to be strong indicators of ranks. They simply lie outside the scope of these studies.

I hope you found this deep-dive both helpful and interesting. Moving forward, I also hope to see ASOs conducting the same experiments that have brought SEO to the center stage, and encourage you to enhance or refute these findings with your own ASO mad science experiments.

Please share your thoughts in the comments below, and let's deconstruct the ranking formula together, one experiment at a time.


Sign up for The Moz Top 10, a semimonthly mailer updating you on the top ten hottest pieces of SEO news, tips, and rad links uncovered by the Moz team. Think of it as your exclusive digest of stuff you don't have time to hunt down but want to read!


from Moz Blog http://ift.tt/1d0IuX0
via IFTTT

Moz Local Dashboard Updates

Posted by NoamC

Today, we're excited to announce some new features and changes to the Moz Local dashboard. We've updated your dashboard to make it easier to manage and gauge the performance of your local search listings.

New and improved dashboard

55656dd0e6cf54.57413440.jpg

We spent a lot of time listening to customer feedback and finding areas where we weren't being as clear as we ought to. We've made great strides in improving Moz Local's dashboard (details below) to give you a lot more information at a glance.

Geo Reporting

55656e552f9c50.19543051.jpg

Our newest reporting view, geo reporting, shows you the relative strength of locations based on geography. The deeper the blue, the stronger the listings in that region. You can look at your scores broken down by state, or zoom in to see the score breakdown by county. Move your mouse over a region to see your average score there.

Scores on the dashboard

55656e67615e70.00335210.png

We're more clearly surfacing the scores for each of your locations right in our dashboard. Now you can see each location's individual score immediately.

Exporting reports

55656eefb28344.08123995.png

55656ed3c60e54.90415681.png

Use the new drop-down at the upper-right corner to download Moz Local reports in CSV format, so that you can access your historical listing data offline and use it to generate your own reports and visualizations.

Search cheat sheet

556579b7b0fb79.07843805.png

If you want to take your search game to the next level, why not start with your Moz Local dashboard? A handy link next to the search bar shows you all the ways you can find what you're looking for.

We're still actively addressing feedback and making improvements to Moz Local over time, and you can let us know what we're missing in the comments below.

We hope that our latest updates will make your Moz Local experience better. But you don't have to take my word for it; head on over to Moz Local to see our new and improved dashboard and reporting experience today!


Sign up for The Moz Top 10, a semimonthly mailer updating you on the top ten hottest pieces of SEO news, tips, and rad links uncovered by the Moz team. Think of it as your exclusive digest of stuff you don't have time to hunt down but want to read!


from Moz Blog http://ift.tt/1Rom94G
via IFTTT

Contenido de aplicaciones de iOS en la Búsqueda de Google


Llevamos un tiempo ayudando a los usuarios a descubrir contenido relevante de aplicaciones de Android en los resultados de búsqueda de Google. Desde hoy, esta tecnología de indexación llega también a las aplicaciones de iOS. Esto significa que los usuarios de ambas plataformas, Android e iOS, podrán abrir contenido de aplicaciones para móviles directamente desde la Búsqueda de Google.

Los enlaces indexados, procedentes de un grupo inicial de aplicaciones con las que hemos estado trabajando, comenzarán a aparecer en iOS en los resultados de búsqueda en los próximos días tanto en la aplicación Google como en Chrome para los usuarios de todo el mundo que hayan iniciado sesión:


Cómo hacer que tu aplicación de iOS sea indexada

Aunque la indexación de aplicaciones para iOS ha comenzado su andadura inicialmente para un pequeño grupo de socios de prueba, estamos trabajando para ampliar la disponibilidad de esta tecnología a un mayor número de desarrolladores de aplicaciones. Hasta que llegue ese momento, sigue estos pasos para obtener las ventajas que proporciona la indexación de aplicaciones para iOS:
  1. Permite que se puedan añadir enlaces profundos en tu aplicación de iOS.
  2. Asegúrate de que sea posible volver a los resultados de la Búsqueda con un clic.
  3. Proporciona anotaciones con enlaces profundos en tu sitio web.
  4. Comunícanos tu interés por esta tecnología. Ten en cuenta que expresar tu interés no garantiza automáticamente que los enlaces profundos de aplicaciones de iOS aparezcan en los resultados de búsqueda. 
Si vas a asistir al Google I/O esta semana, no te pierdas nuestra presentación titulada “Get your app in the Google index” (Consigue que tu aplicación sea indexada por Google), donde podrás aprender más sobre el indexado de aplicaciones. También encontrarás documentación detallada sobre la indexación de aplicaciones para iOS en g.co/AppIndexing.

Si tienes más preguntas, pásate por nuestro foro de ayuda para webmasters.


Escrito por Eli Wald, Product Manager,Publicado por Javier Pérez equipo de calidad de búsqueda.


from El Blog para Webmasters http://ift.tt/1KoDUge
via IFTTT

Tuesday, May 26, 2015

Exposing The Generational Content Gap: Three Ways to Reach Multiple Generations

Posted by AndreaLehr

With more people of all ages online than ever before, marketers must create content that resonates with multiple generations. Successful marketers realize that each generation has unique expectations, values and experiences that influence consumer behaviors, and that offering your audience content that reflects their shared interests is a powerful way to connect with them and inspire them to take action.

We’re in the midst of a generational shift, with Millennials expected to surpass Baby Boomers in 2015 as the largest living generation. In order to be competitive, marketers need to realize where key distinctions and similarities lie in terms of how these different generations consume content and share it with with others.

To better understand the habits of each generation, BuzzStream and Fractl surveyed over 1,200 individuals and segmented their responses into three groups: Millennials (born between 1977–1995), Generation X (born between 1965–1976), and Baby Boomers (born between 1946–1964). [Eds note: The official breakdown for each group is as follows: Millennials (1981-1997), Generation X (1965-1980), and Boomers (1946-1964)]

Our survey asked them to identify their preferences for over 15 different content types while also noting their opinions on long-form versus short-form content and different genres (e.g., politics, technology, and entertainment).

We compared their responses and found similar habits and unique trends among all three generations.

Here's our breakdown of the three key takeaways you can use to elevate your future campaigns:

1. Baby Boomers are consuming the most content

However, they have a tendency to enjoy it earlier in the day than Gen Xers and Millennials.

Although we found striking similarities between the younger generations, the oldest generation distinguished itself by consuming the most content. Over 25 percent of Baby Boomers consume 20 or more hours of content each week. Additional findings:

  • Baby Boomers also hold a strong lead in the 15–20 hours bracket at 17 percent, edging out Gen Xers and Millennials at 12 and 11 percent, respectively
  • A majority of Gen Xers and Millennials—just over 22 percent each—consume between 5 and 10 hours per week
  • Less than 10 percent of Gen Xers consume less than five hours of content a week—the lowest of all three groups

How Much Time We Spend Consuming Content

We also compared the times of day that each generation enjoys consuming content. The results show that most of our respondents—over 30 percent— consume content between 8 p.m. and midnight. However, there are similar trends that distinguish the oldest generation from the younger ones:

  • Baby Boomers consume a majority of their content in the morning. Nearly 40 percent of respondents are online between 5 a.m. and noon.
  • The least popular time for most respondents to engage with content online is late at night, between midnight and 5 a.m., earning less than 10 percent from each generation
  • Gen X is the only generation to dip below 10 percent in the three U.S. time zones: 5 a.m. to 9 a.m., 6 to 8 p.m., and midnight to 5 a.m.

When Do We Consume Content

When it comes to which device each generation uses to consume content, laptops are the most common, followed by desktops. The biggest distinction is in mobile usage: Over 50 percent of respondents who use their mobile as their primary device for content consumption are Millennials. Other results reveal:

  • Not only do Baby Boomers use laptops the most (43 percent), but they also use their tablets the most. (40 percent of all primary tablet users are Baby Boomers).
  • Over 25 percent of Millennials use a mobile device as their primary source for content
  • Gen Xers are the least active tablet users, with less than 8 percent of respondents using it as their primary device

Device To Consume Content2. Preferred content types and lengths span all three generations

One thing every generation agrees on is the type of content they enjoy seeing online. Our results reveal that the top four content types— blog articles, images, comments, and eBooks—are exactly the same for Baby Boomers, Gen Xers, and Millennials. Additional comparisons indicate:

  • The least preferred content types—flipbooks, SlideShares, webinars, and white papers—are the same across generations, too (although not in the exact same order)
  • Surprisingly, Gen Xers and Millennials list quizzes as one of their five least favorite content types

Most Consumed Content Type

All three generations also agree on ideal content length, around 300 words. Further analysis reveals:

  • Baby Boomers have the highest preference for articles under 200 words, at 18 percent
  • Gen Xers have a strong preference for articles over 500 words compared to other generations. Over 20 percent of respondents favor long-form articles, while only 15 percent of Baby Boomers and Millennials share the same sentiment.
  • Gen Xers also prefer short articles the least, with less than 10 percent preferring articles under 200 words

Content Length PreferencesHowever, in regards to verticals or genres, where they consume their content, each generation has their own unique preference:

  • Baby Boomers have a comfortable lead in world news and politics, at 18 percent and 12 percent, respectively
  • Millennials hold a strong lead in technology, at 18 percent, while Baby Boomers come in at 10 percent in the same category
  • Gen Xers fall between Millennials and Baby Boomers in most verticals, although they have slight leads in personal finance, parenting, and healthy living
  • Although entertainment is the top genre for each generation, Millennials and Baby Boomers prefer it slightly more than than Gen Xers do

Favorite Content Genres

3. Facebook is the preferred content sharing platform across all three generations

Facebook remains king in terms of content sharing, and is used by about 60 percent of respondents in each generation studied. Surprisingly, YouTube came in second, followed by Twitter, Google+, and LinkedIn, respectively. Additional findings:

  • Baby Boomers share on Facebook the most, edging out Millennials by only a fraction of a percent
  • Although Gen Xers use Facebook slightly less than other generations, they lead in both YouTube and Twitter, at 15 percent and 10 percent, respectively
  • Google+ is most popular with Baby Boomers, at 8 percent, nearly double that of both Gen Xers and Millennials

Preferred Social PlatformAlthough a majority of each generation is sharing content on Facebook, the type of content they are sharing, especially visuals, varies by each age group. The oldest generation prefers more traditional content, such as images and videos. Millennials prefer newer content types, such as memes and GIFs, while Gen X predictably falls in between the two generations in all categories except SlideShares. Other findings:

  • The most popular content type for Baby Boomers is video, at 27 percent
  • Parallax is the least popular type for every generation, earning 1 percent or less in each age group
  • Millennials share memes the most, while less than 10 percent of Baby Boomers share similar content

Most Shared Visual ContentMarketing to several generations can be challenging, given the different values and ideas that resonate with each group. With the number of online content consumers growing daily, it’s essential for marketers to understand the specific types of content that each of their audiences connect with, and align it with their content marketing strategy accordingly.

Although there is no one-size-fits-all campaign, successful marketers can create content that multiple generations will want to share. If you feel you need more information getting started, you can review this deck of additional insights, which includes the preferred video length and weekend consuming habits of each generation discussed in this post.


Sign up for The Moz Top 10, a semimonthly mailer updating you on the top ten hottest pieces of SEO news, tips, and rad links uncovered by the Moz team. Think of it as your exclusive digest of stuff you don't have time to hunt down but want to read!


from Moz Blog http://ift.tt/1FWTHVJ
via IFTTT

How to Use Server Log Analysis for Technical SEO

Posted by SamuelScott

It's ten o'clock. Do you know where your logs are?

I'm introducing this guide with a pun on a common public-service announcement that has run on late-night TV news broadcasts in the United States because log analysis is something that is extremely newsworthy and important.

If your technical and on-page SEO is poor, then nothing else that you do will matter. Technical SEO is the key to helping search engines to crawl, parse, and index websites, and thereby rank them appropriately long before any marketing work begins.

The important thing to remember: Your log files contain the only data that is 100% accurate in terms of how search engines are crawling your website. By helping Google to do its job, you will set the stage for your future SEO work and make your job easier. Log analysis is one facet of technical SEO, and correcting the problems found in your logs will help to lead to higher rankings, more traffic, and more conversions and sales.

Here are just a few reasons why:

  • Too many response code errors may cause Google to reduce its crawling of your website and perhaps even your rankings.
  • You want to make sure that search engines are crawling everything, new and old, that you want to appear and rank in the SERPs (and nothing else).
  • It's crucial to ensure that all URL redirections will pass along any incoming "link juice."

However, log analysis is something that is unfortunately discussed all too rarely in SEO circles. So, here, I wanted to give the Moz community an introductory guide to log analytics that I hope will help. If you have any questions, feel free to ask in the comments!

What is a log file?

Computer servers, operating systems, network devices, and computer applications automatically generate something called a log entry whenever they perform an action. In a SEO and digital marketing context, one type of action is whenever a page is requested by a visiting bot or human.

Server log entries are specifically programmed to be output in the Common Log Format of the W3C consortium. Here is one example from Wikipedia with my accompanying explanations:

127.0.0.1 user-identifier frank [10/Oct/2000:13:55:36 -0700] "GET /apache_pb.gif HTTP/1.0" 200 2326
  • 127.0.0.1 -- The remote hostname. An IP address is shown, like in this example, whenever the DNS hostname is not available or DNSLookup is turned off.
  • user-identifier -- The remote logname / RFC 1413 identity of the user. (It's not that important.)
  • frank -- The user ID of the person requesting the page. Based on what I see in my Moz profile, Moz's log entries would probably show either "SamuelScott" or "392388" whenever I visit a page after having logged in.
  • [10/Oct/2000:13:55:36 -0700] -- The date, time, and timezone of the action in question in strftime format.
  • GET /apache_pb.gif HTTP/1.0 -- "GET" is one of the two commands (the other is "POST") that can be performed. "GET" fetches a URL while "POST" is submitting something (such as a forum comment). The second part is the URL that is being accessed, and the last part is the version of HTTP that is being accessed.
  • 200 -- The status code of the document that was returned.
  • 2326 -- The size, in bytes, of the document that was returned.

Note: A hyphen is shown in a field when that information is unavailable.

Every single time that you -- or the Googlebot -- visit a page on a website, a line with this information is output, recorded, and stored by the server.

Log entries are generated continuously and anywhere from several to thousands can be created every second -- depending on the level of a given server, network, or application's activity. A collection of log entries is called a log file (or often in slang, "the log" or "the logs"), and it is displayed with the most-recent log entry at the bottom. Individual log files often contain a calendar day's worth of log entries.

Accessing your log files

Different types of servers store and manage their log files differently. Here are the general guides to finding and managing log data on three of the most-popular types of servers:

What is log analysis?

Log analysis (or log analytics) is the process of going through log files to learn something from the data. Some common reasons include:

  • Development and quality assurance (QA) -- Creating a program or application and checking for problematic bugs to make sure that it functions properly
  • Network troubleshooting -- Responding to and fixing system errors in a network
  • Customer service -- Determining what happened when a customer had a problem with a technical product
  • Security issues -- Investigating incidents of hacking and other intrusions
  • Compliance matters -- Gathering information in response to corporate or government policies
  • Technical SEO -- This is my favorite! More on that in a bit.

Log analysis is rarely performed regularly. Usually, people go into log files only in response to something -- a bug, a hack, a subpoena, an error, or a malfunction. It's not something that anyone wants to do on an ongoing basis.

Why? This is a screenshot of ours of just a very small part of an original (unstructured) log file:

Ouch. If a website gets 10,000 visitors who each go to ten pages per day, then the server will create a log file every day that will consist of 100,000 log entries. No one has the time to go through all of that manually.

How to do log analysis

There are three general ways to make log analysis easier in SEO or any other context:

  • Do-it-yourself in Excel
  • Proprietary software such as Splunk or Sumo-logic
  • The ELK Stack open-source software

Tim Resnik's Moz essay from a few years ago walks you through the process of exporting a batch of log files into Excel. This is a (relatively) quick and easy way to do simple log analysis, but the downside is that one will see only a snapshot in time and not any overall trends. To obtain the best data, it's crucial to use either proprietary tools or the ELK Stack.

Splunk and Sumo-Logic are proprietary log analysis tools that are primarily used by enterprise companies. The ELK Stack is a free and open-source batch of three platforms (Elasticsearch, Logstash, and Kibana) that is owned by Elastic and used more often by smaller businesses. (Disclosure: We at Logz.io use the ELK Stack to monitor our own internal systems as well as for the basis of our own log management software.)

For those who are interested in using this process to do technical SEO analysis, monitor system or application performance, or for any other reason, our CEO, Tomer Levy, has written a guide to deploying the ELK Stack.

Technical SEO insights in log data

However you choose to access and understand your log data, there are many important technical SEO issues to address as needed. I've included screenshots of our technical SEO dashboard with our own website's data to demonstrate what to examine in your logs.

Bot crawl volume

It's important to know the number of requests made by Baidu, BingBot, GoogleBot, Yahoo, Yandex, and others over a given period time. If, for example, you want to get found in search in Russia but Yandex is not crawling your website, that is a problem. (You'd want to consult Yandex Webmaster and see this article on Search Engine Land.)

Response code errors

Moz has a great primer on the meanings of the different status codes. I have an alert system setup that tells me about 4XX and 5XX errors immediately because those are very significant.

Temporary redirects

Temporary 302 redirects do not pass along the "link juice" of external links from the old URL to the new one. Almost all of the time, they should be changed to permanent 301 redirects.

Crawl budget waste

Google assigns a crawl budget to each website based on numerous factors. If your crawl budget is, say, 100 pages per day (or the equivalent amount of data), then you want to be sure that all 100 are things that you want to appear in the SERPs. No matter what you write in your robots.txt file and meta-robots tags, you might still be wasting your crawl budget on advertising landing pages, internal scripts, and more. The logs will tell you -- I've outlined two script-based examples in red above.

If you hit your crawl limit but still have new content that should be indexed to appear in search results, Google may abandon your site before finding it.

Duplicate URL crawling

The addition of URL parameters -- typically used in tracking for marketing purposes -- often results in search engines wasting crawl budgets by crawling different URLs with the same content. To learn how to address this issue, I recommend reading the resources on Google and Search Engine Land here, here, here, and here.

Crawl priority

Google might be ignoring (and not crawling or indexing) a crucial page or section of your website. The logs will reveal what URLs and/or directories are getting the most and least attention. If, for example, you have published an e-book that attempts to rank for targeted search queries but it sits in a directory that Google only visits once every six months, then you won't get any organic search traffic from the e-book for up to six months.

If a part of your website is not being crawled very often -- and it is updated often enough that it should be -- then you might need to check your internal-linking structure and the crawl-priority settings in your XML sitemap.

Last crawl date

Have you uploaded something that you hope will be indexed quickly? The log files will tell you when Google has crawled it.

Crawl budget

One thing I personally like to check and see is Googlebot's real-time activity on our site because the crawl budget that the search engine assigns to a website is a rough indicator -- a very rough one -- of how much it "likes" your site. Google ideally does not want to waste valuable crawling time on a bad website. Here, I had seen that Googlebot had made 154 requests of our new startup's website over the prior twenty-four hours. Hopefully, that number will go up!

As I hope you can see, log analysis is critically important in technical SEO. It's eleven o'clock -- do you know where your logs are now?

Additional resources


Sign up for The Moz Top 10, a semimonthly mailer updating you on the top ten hottest pieces of SEO news, tips, and rad links uncovered by the Moz team. Think of it as your exclusive digest of stuff you don't have time to hunt down but want to read!


from Moz Blog http://ift.tt/1LEcKD5
via IFTTT